


Of Razors and Blades: The Economics of Illumina, PacBio, and 10x Xenium
Breaking down the unit economics of three life sciences tools product lines

The most interesting part of life sciences tools investing is that similar businesses can have profoundly different economics. This makes tools different than some other healthcare subsectors (e.g., pharma, med device) where there are often similar economics between similar companies.
DNA sequencing instruments are the canonical example. Illumina - the market leader - has been one of healthcare’s most profitable companies, historically putting up 27%+ operating margins despite significant discretionary spend in R&D. On the opposite side, PacBio - which also sells DNA sequencing instruments - still does negative 100% operating margins despite having been a public company for more than 14 years1.
Both companies employ the razor/razorblade business model, in which lower-margin instruments generate a stream of higher-margin consumable revenue over the lifetime of the instrument. So why is the ultimate profitability so different?
Here, I’ll dive into what exactly makes Illumina great, what makes PacBio struggle, and use the resulting lessons to analyze one of the most exciting new life sciences tools product lines: 10x Genomics’ Xenium franchise.
Inimitable Illumina
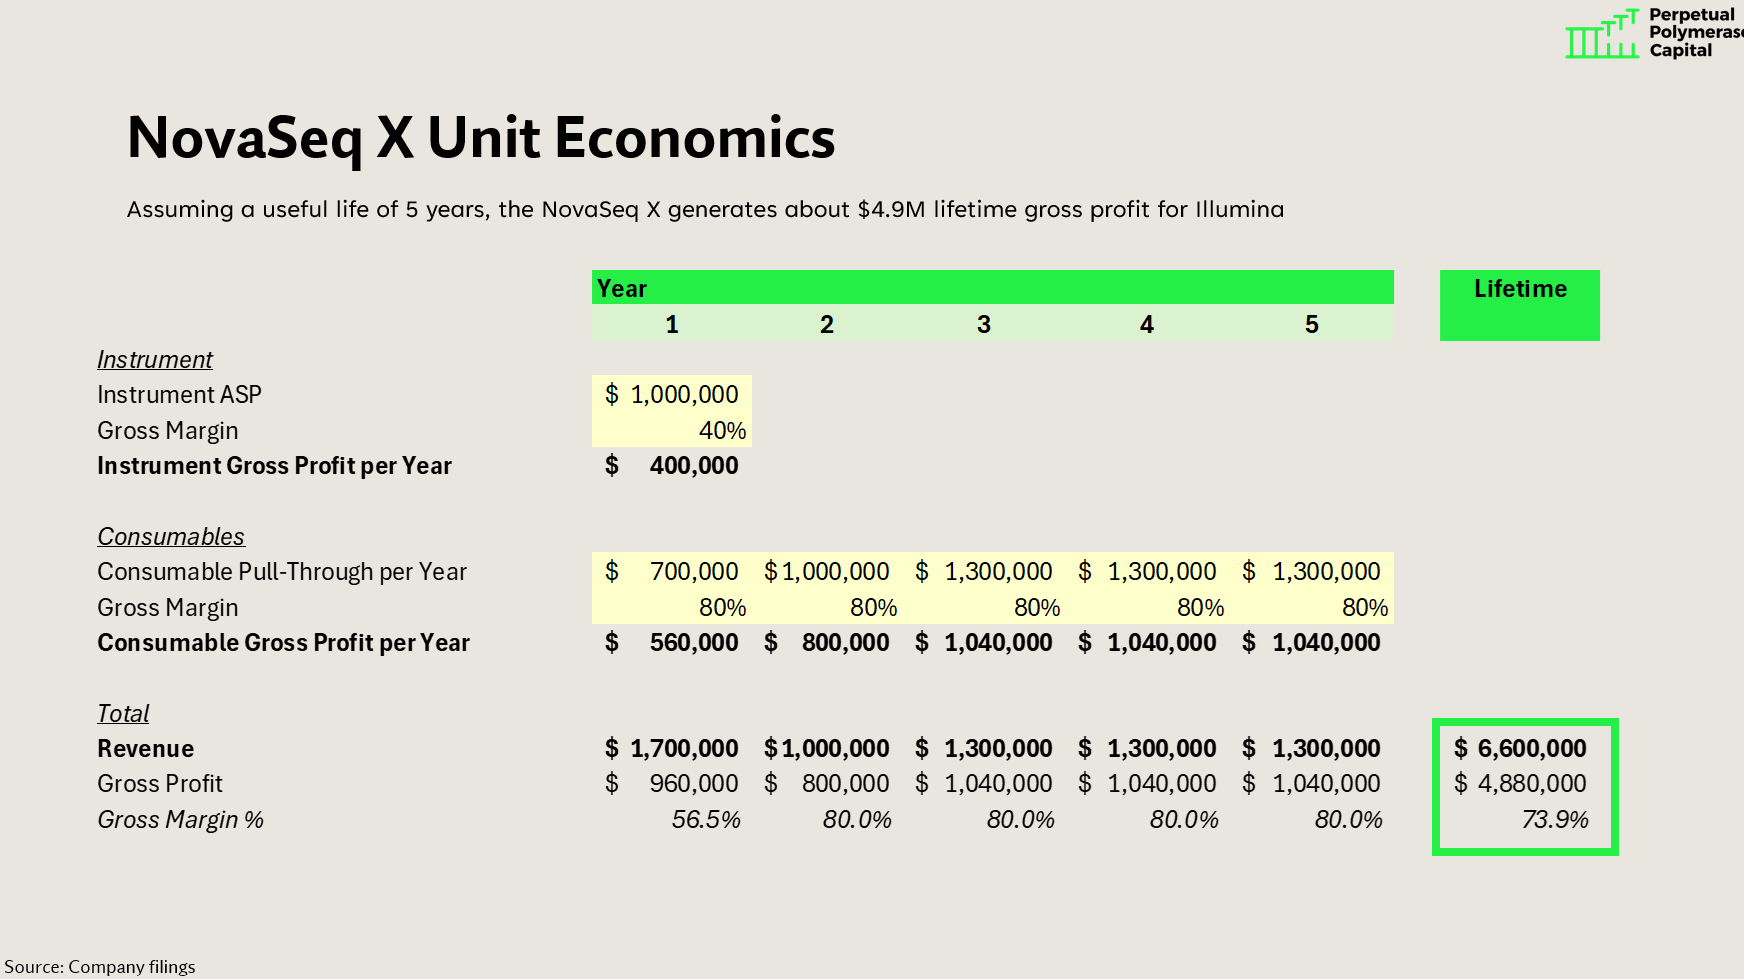
Illumina’s highest-end sequencer - the NovaSeq X - is one of the most profitable product lines I’ve analyzed.
The NovaSeq X costs approximately $1M to buy. This instrument revenue comes in at approximately 40% gross margin. Thus, when Illumina sells a NovaSeq X instrument - the razor - they make roughly $400K gross profit up front2.
The real magic happens with the blades. NovaSeq X customers typically ramp up to buy $1.3M consumables per year3, for each of the ~5 years of the instrument’s life. This metric - the amount of consumable revenue generated by each instrument each year - is referred to as “consumable pull-through”. Because Illumina consumables carry 80% gross margins, the NovaSeq X generates $1M gross profit each year from consumable sales.
Add it all together, and when Illumina sells a NovaSeq X, they are effectively selling $6.6M lifetime revenue and $4.9M lifetime gross profit, as per the below graphic.
Chart: Per-year and lifetime revenue and gross profit generated by a single Illumina NovaSeq X box.
$4.9M gross profit per instrument seems good. But how good ultimately depends on how much sales & marketing spend is required to sell the instrument.
Let’s estimate it. Assume each Illumina sales rep only sells one NovaSeq X instrument per year, and fully loaded sales & marketing costs per rep (e.g., salaries, bonuses, marketing, sales support, travel, etc.) is $833K4.
This means $833K spent in sales & marketing generates $4.9M in lifetime gross profit. This is a 5.9x 5-year LTV-to-CAC, which is excellent. As we can see in the chart below, Illumina pays off its entire sales & marketing cost with the first year’s gross profit, and then just continues to stack gross profit from there.
Chart: NovaSeq X LTV to CAC

Another way to think about this is in terms of margin: each NovaSeq X produces $6.6M revenue and $4.9M gross profit - thus, a 74% gross margin. Sales & marketing of $833K represents about 13% of the $6.6M revenue. Thus, the lifetime contribution margin of the NovaSeq X is 61% (74% gross margin - 13% sales & marketing5).
This is an incredibly efficient sales motion. Indeed, if you assume mature R&D is 15% of revenue and mature G&A is another 10% of revenue, a 61% contribution margin translates to the potential for 36% operating margins:
61% contribution margin
(-) 15% R&D
(-) 10% G&A
= 36% operating margins
Again, this math assumes Illumina reps only place one NovaSeq X instrument per year. If they place 2 per year, the sales & marketing spend per instrument gets cut in half ($833K —> $417K), resulting in even higher margins.
Precarious PacBio
Selling DNA sequencing instruments seems like an amazing business. So why is PacBio - a similar company - so unprofitable?6
PacBio’s flagship instrument is the Revio. PacBio’s sequencing technology and Illumina’s differ in fundamental ways, but it’s a useful oversimplification to say that PacBio sequencers generate better data (e.g., longer, more accurate stretches of DNA) while Illumina’s sequencers generate data more data, more cheaply. Customers can sequence a billion DNA bases on the NovaSeq X for $2, compared to $8 on a Revio. This metric is called “cost per gigabase” or “cost per GB”, and is a critical metric in the industry.
The Revio instrument itself likely sells for $600K, at 25% instrument gross margins. Thus, $150K gross profit upfront.
Where the Revio struggles compared to the NovaSeq X is - again - in the blades. The Revio does about $300K consumable revenue per year, at ~55% gross margin7. You can immediately see the two big problems. First, Revio’s consumable pull-through is 4x lower than the NovaSeq X ($300K vs. $1.3M). Second, consumable gross margins are lower (55% vs. 80%). All told, whereas the NovaSeq X will produce $1M consumable gross profit per year, the Revio will only do $165K.
Over the course of a 5 year lifetime, Revio will produce $1.9M revenue and $860K gross profit - 5.7x lower than the NovaSeq X’s $4.9M gross profit.
Chart: Per-year and lifetime revenue and gross profit generated by a single PacBio Revio box.

Thus, for PacBio sales reps to generate the same gross profit dollars as Illumina reps, they need to sell 5.7x more Revios each year.
Given that we assumed Illumina reps place 1 NovaSeq X box per year, this would entail ~6 boxes per rep.
Is this reasonable? It would require significant improvement compared history. Based on the rep count disclosed in their filings, PacBio sold about 3 Revios per rep in 2023. 2024 was more challenged: 1.3 Revios per rep. But, 2024 was a brutal year for life sciences tools companies, so if we are being charitable8, 2023 is probably the appropriate benchmark year.
If each rep can place 3 Revios per year, this equates to $278K sales & marketing costs per Revio9. But, again, the lifetime value of the Revio is only $860K. Thus, the 5-year LTV to CAC is only 3.1x.
Chart: Revio LTV to CAC

This is a thin LTV to CAC - much lower than Illumina.
Even if PacBio reps did sell enough Revios to make the LTV to CAC equal to Illumina, PacBio would still not be as good a business. That’s because gross profit margin is much lower for Revio than NovaSeq X: 45% vs. 74%. This is bad because it means R&D and G&A have to be a lower share of revenue to generate strong operating margins. In the example above, Illumina generated 74% gross margins, 61% contribution margins, and then 36% operating profit margins, assuming 25% of revenue devoted to R&D and G&A. But since PacBio only has 45% gross margins, operating margins are much thinner. With 45% gross margins, even if sales & marketing is truly elite (~8% of revenue), this only yields 37% contribution margins, and 12% operating margins, assuming the same 25% of revenue devoted to R&D and G&A. Indeed, it is quite hard for PacBio to reach breakeven with 45% gross margins - the only way is to be hyper-disciplined in R&D and G&A.
Is there a constructive way to think about the Revio franchise? Could it ever generate 15-20% operating margin? It requires improvement in three things, each of which will be difficult in its own right:
Higher sales rep efficiency (more Revios placed per rep)
Higher consumable pull-through per Revio
Higher consumable gross margins
Specifically, in order to achieve this operating margin, PacBio would need to do the following:
4 Revios sold per rep per year (up from ~3x in in 2023)
$350K annual-pull through for Revio (up from ~$240K in 2024)
65% consumable gross margins (up from ~55% in 2024)
In addition, they’d have to actually bring R&D and G&A down to 25% of revenue10. Never say never - but this is a tall task.
PacBio’s Predicament: The Illumina Force Choke
This exercise also reveals the nature of Illumina’s Darth Vader-esque “force choke”11 around PacBio’s business: I contend that Illumina effectively dictates PacBio’s gross margins.
Think about it this way: PacBio is selling consumables at $8 per GB at 55% gross margin. That means it costs PacBio about $3.60 per GB to make the consumables ($8 revenue - $3.60 costs = $4.40 gross profit, which is 55% gross margin).
But wait: why doesn’t PacBio just sell their consumables at $18 per GB instead of $8? That way, with $3.60 production costs, they would achieve 80% gross margins, just like Illumina. This would make their unit economics much more tractable, and the Revio would be a much better business.
I suspect they can’t do this precisely because Illumina prices at $2 per GB. And while customers may be OK paying 4x more for PacBio, it’s likely a bridge too far to pay 9x more than Illumina12.
Meanwhile, Illumina, as low cost leader, can set their price however they want. At $2 per GB consumable price and 80% gross margins, Illumina produces consumables at $0.40 per GB ($2 revenue - $0.40 costs = $1.6 gross profit, which is 80% gross margin.) Illumina likely chose $2 per GB as their price specifically in order to achieve 80% gross margins13. Indeed, back in the early 2010s, when Illumina’s cost to produce consumables was about as high as PacBio’s now (e.g., $3.60 per GB), they still had excellent gross margins - because they could price on their own terms and didn’t have a lower cost competitor.
Gross margins are often extremely helpful to cut through the marketing and determine who really has competitive differentiation. The Revio produces beautiful, high-quality data - all scientists who use Revio will tell you this. But as beautiful as it is, customers aren’t willing to pay enough for it to make PacBio a great business14.
Illumina, on the other hand, can set prices based on their own discretion, to achieve their gross margin targets. That is true differentiation. That said, while Illumina has historically been able to do this, new competitors like Ultima and Roche will put their continued ability to do this to the test over the next several years.
X-Raying Xenium
From this exercise, it becomes clear that three things really matter for how great razor/razorblade businesses are:
Razors (instruments) placed per sales rep
Razorblade (consumable) pull-through per year: NovaSeq X at $1.3M versus Revio at $250K
Razorblade (consumable) gross margins: NovaSeq X at 80% versus Revio at 55%
How about 10x Genomics Xenium? Unlike the NovaSeq X and the Revio, both of which are DNA sequencing instruments, the Xenium analyzes RNA, and specifically determines which cells express which RNAs. This type of analysis - “spatial transcriptomics” - is one of most exciting new areas of life sciences tools to emerge over the last decade. But is it a good business?
I am optimistic about Xenium’s prospects, but it really hinges on factor #1: how many instruments their reps can place each year.
This is because Xenium looks like Revio in some areas, and NovaSeq X in other areas.
On consumable pull-through, Xenium looks much more like Revio: in the $175K gross profit per year range15, much lower than the NovaSeq X at $1M.
But on the consumable gross margin, Xenium looks much more like NovaSeq X: 75% gross margins, similar to NovaSeq X at 80% and much higher than Revio at 55%. Since Xenium analyzes RNA and not DNA, they are immune to the Illumina force choke.
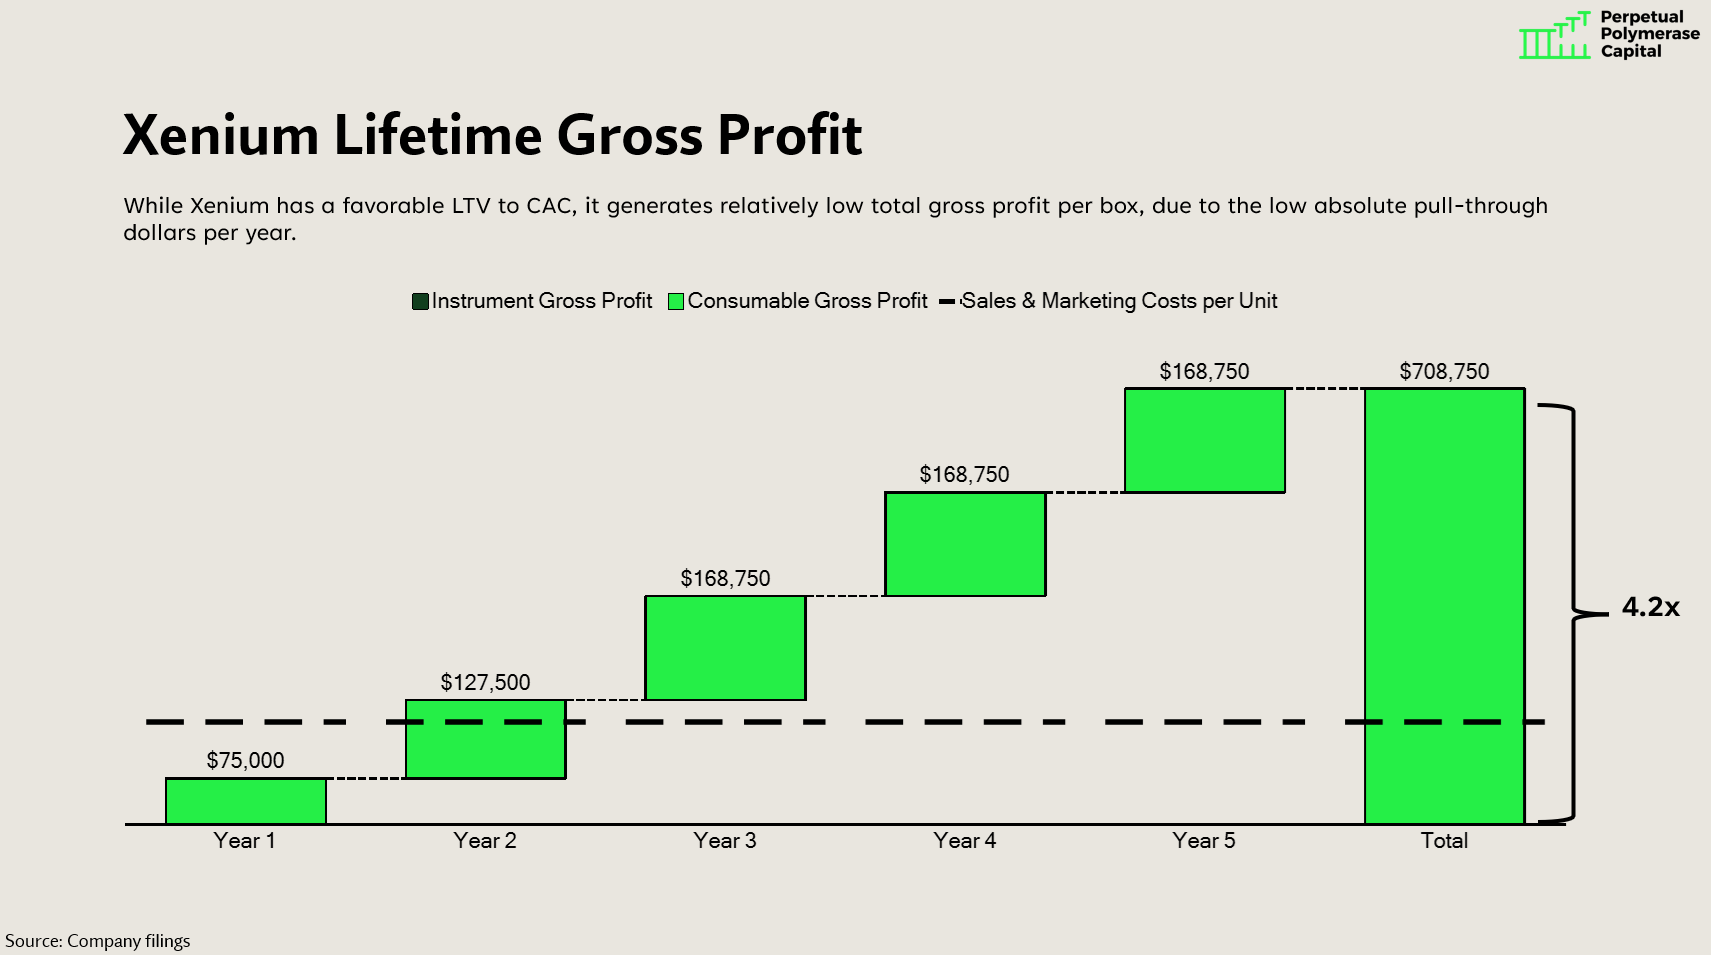
When you run through the same exercise we did above, each Xenium should produce around $710K lifetime gross profit per box - slightly lower than Revio, albeit at a significantly higher gross margin (59% gross margin for Xenium, versus 45% for Revio).
Chart: Per-year and lifetime revenue and gross profit generated by a single 10x Genomics Xenium box.

Thus, the key is how many boxes each rep can sell per year. If they can sell a lot, there will be high contribution margins, which will enable healthy operating margins. If they can’t, contribution margins will be lower, which will make it harder for 10x to generate meaningful operating margin.
Here, I’m optimistic about 10x sales reps being able to place enough instruments to make Xenium a good business.
My rule of thumb is that sales reps in life sciences tools can sell about $1-1.5M of expensive instruments per year. Since Xenium’s ASP is about $250K, this would imply Xenium reps could sell 4 to 6 Xenium boxes per rep per year.
If Xenium reps place 5 boxes per rep per year, the business should be a strong one, with 4.2x LTV to CAC and 45% contribution margin.
Chart: Xenium LTV to CAC
Using our standard 25% of revenue devoted to R&D and G&A, 45% contribution margin translates to 20% operating margin.
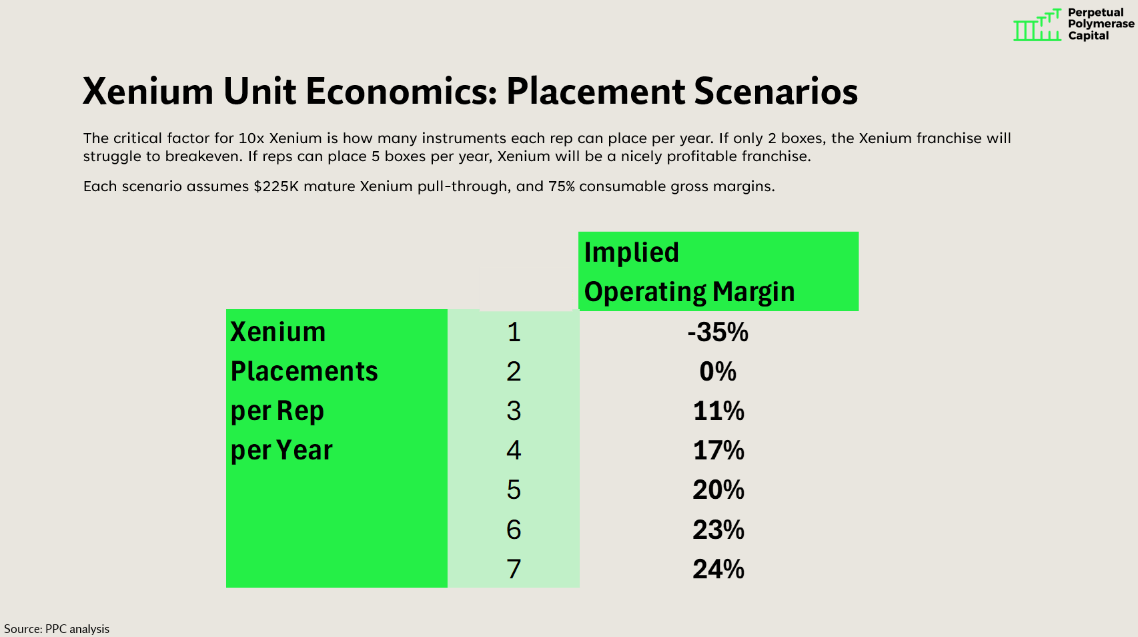
But all this is highly dependent on reps selling 5 boxes per year. If the number is significantly lower, the business works much less well. For example, at 2 boxes sold per rep per year, the implied operating margin would be 0%. The table below shows the implied operating margin in various scenarios of Xenium placements per rep per year, from 1-7.
Chart: Xenium implied operating margin based on placements per rep per year scenarios
Conclusion
While razor/razorblade businesses look similar from afar, the specifics of their pricing and margin structure can produce starkly different business outcomes. The three critical factors are sales rep productivity, consumable pull-through, and consumable gross margin.
Importantly, metrics can always change. Sales reps can become more or less productive based on many factors, like end-customer budget health. New customer cohorts could do more or less pull-through than older customer cohorts. Gross margins can move upwards or downwards, based on pricing and production costs. Competitors can enter and dramatically change all three metrics. Additionally, one area I haven’t explored here is cost to serve. If any of these instruments require significant ongoing sales & support expenses that aren’t captured in the services contracts, that also has an impact on the unit economics.
But in general, the success of razor/razorblade businesses are defined by these three factors.
Illumina is an amazing business because of high pull through and high gross margins. Even if their reps only sell 1 NovaSeq X per year, the business works beautifully.
Conversely, PacBio struggles for the same reasons: low pull-through, and low consumable gross margins. Even assuming their reps are relatively productive, it’s hard to make the math work.
10x Xenium is in between: pull through looks like PacBio, but gross margins look more like Illumina. For now, the critical factor that will make or break Xenium is how well their reps can sell them.
I kind of love PacBio’s ability to consistently avoid death despite economics that have really never worked. In 20 years, post-Singularity, I am confident that PacBio will still be a public company, will still be burning cash, and will still be trading at a premium multiple.
All numbers in this essay - gross margins, ASPs, etc., - are estimates based on management commentary at earnings calls. While not precisely correct, I believe most are “close enough”.
This was the average across the entire fleet of instruments in 2024. Some do more, some do less.
My rule of thumb is that reps cost $250K each, and reps are 30% of sales & marketing costs. This means $833K total S&M costs per rep ($250K/30%)
The more precise way to do this exercise would be to discount future cash flows back to the present (e.g., $1.3M consumable pull-through in 5 years is worth less than $1.3M consumable pull-through this year). But this is the 101 essay.
To be clear, this is not to cast aspersions on the Revio as a product. The Revio is an excellent sequencing box that produces fantastic data. As a business, though, it has struggled.
These numbers are charitable to PacBio. The entire company gross margin was low-30s in 2024, so instrument and/or consumable gross margin is likely lower than what I outline here. Revio pull-through in the back half of 2024 was $250K, so $300K is slightly north of what they’re currently doing.
For the sake of all these companies and my future returns, let’s hope the LS tools market eventually recovers! That said, with NIH funding looking quite grim in the near future, it may well get worse before it gets better.
$833K all-in S&M costs per rep / 3 instruments per rep per year
This is quite far away right now. In 2024, R&D alone was 95% of revenue for PacBio, much higher than the 15% we assume here at maturity. They’d need to add a lot more revenue to reach these pro-forma numbers.
https://www.starwars.com/databank/force-choke
Some people will say it’s actually Oxford Nanopore’s pricing that dictates PacBio’s gross margins, since they are the closest long-read sequencing technology. I disagree - I think Illumina has both companies in a force choke.
Will Ultima and/or Roche change the calculus such that Illumina no longer prices discretionarily based on their own COGS? Perhaps. I do think Ultima’s announcement of $1 per GB several years ago made Illumina rush out the NovaSeq X faster than they would have otherwise wanted to.
The other alternative would be for PacBio to decrease its own production costs significantly. If they could bring down production costs per GB from $3.60 to $1.60, that would also generate 80% gross margins. I’m not deep enough in the engineering of the SMRT cells to tell you why it costs so much more for PacBio to produce consumables than Illumina.
I assume Xenium mature pull-through per year is $225K at 75% consumable gross margins. There are some who think pull-through will be higher and some who think it will be lower; I think this is a reasonable assumption.
Great post. I wrote a summary on Bluesky. https://bsky.app/profile/albertvilella.bsky.social/post/3lja3zowmqc2i
Thank you so much for such a well-explained post. This is the first time I, a scientist, understood the businesses better.